Netflix top 10 data begins from July 4th, 2021 and currently goes up to December 28th, 2025
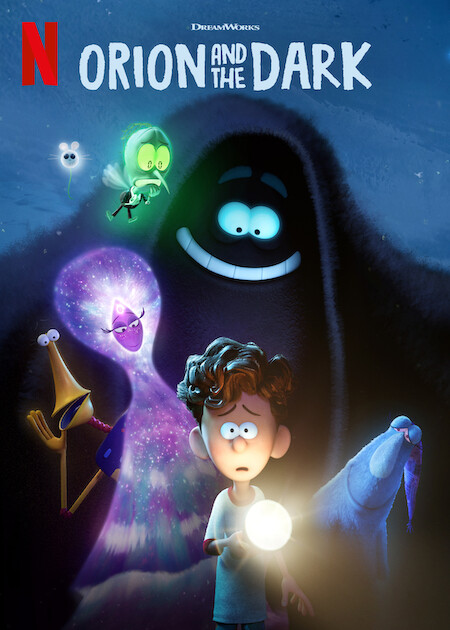
Orion and the Dark Overview
 Released on Netflix: Friday, February 2nd, 2024
Description: A boy with an active imagination faces his fears on an unforgettable journey through the night with his new friend: a giant, smiling creature named Dark.
Language: English
Genre: Animation, Adventure, Comedy
Rating: TV-Y7
Runtime: 90 min
Go to Country Stats
Official Netflix Top 10 Data
Note: INITIAL RELEASE indicates the first release, while NEW EPISODES indicates subsequent episode drops.
Number of Weeks in Netflix Global Top 10s: 4Total Hours in the Top 10s: 51,800,000 Hours
Total Views/CVE in the Top 10s: 33,400,000 Views
| Week in Top 10 | Week Period | Hours Watched | Views / CVE | Weekly Rank |
|---|---|---|---|---|
| 1 | Jan 28 to Feb 4, 2024 INITIAL RELEASE | 15,500,000 | 10,000,000 | 2 |
| 2 | Feb 4 to Feb 11, 2024 | 19,700,000 (+27%) | 12,700,000 | 2 |
| 3 | Feb 11 to Feb 18, 2024 | 10,800,000 (-45%) | 7,000,000 | 6 |
| 4 | Feb 18 to Feb 25, 2024 | 5,800,000 (-46%) | 3,700,000 | 9 |
Netflix Engagement Reports
| Title | Hours Viewed | Views (CVE) | Rank |
|---|---|---|---|
| Jan-Jun 2024 | |||
| Orion and the Dark | 71,700,000 | 46,300,000 | #25 |
| Jul-Dec 2024 | |||
| Orion and the Dark | 17,400,000 | 11,200,000 | #245 |
| Jan-Jun 2025 | |||
| Orion and the Dark | 11,700,000 | 7,500,000 | #379 |