Pile of 3D Netflix Logos – Picture: Adobe Stock
Netflix cancelations are plentiful and although there are stats to suggest Netflix’s cancelation rate is about the same as other streamers and networks, there’s at least the perception that Netflix does it more than most. What goes behind a decision to renew or cancel a Netflix show? Let’s take a look.
Earlier this year, we published a piece on whether Netflix really does cancel everything and found that by and large, Netflix does renew more than it cancels.
In either case, cancelations can often confuse fans of shows as to why one show got renewed and one show got canceled. Is it as simple as more people watching one and less the other?
The answer is certainly yes to that question but there’s a lot more than ultimately goes into it.
Netflix Has Internal Scores for All Programming
Naturally, Netflix has a ton of data at its disposal, allowing them to quickly determine whether a show earned back what it cost to make and no doubt see ahead of time whether a show will hit certain targets.
Traditionally, knowing what something makes is pretty easy. If it’s a movie, you have the box office; if it’s a TV show, you have advertising revenue and viewership numbers. But in the streaming world, things are a little harder to nail down as a customer subscribes to everything.
The closest we’ve ever come to learning about internal decision-making and metrics Netflix uses internally was via a Bloomberg exclusive report by Lucas Shaw during the Dave Chappelle controversy in late 2021.
The entire article is worth reading but let’s discuss the key points.

Dave Chappelle’s The Closer – Picture: Netflix
They summarized the special based on “financial performance,” which is an internal way of determining how much something made for Netflix vs how much it cost.
According to Shaw, Netflix “relies on its own idiosyncratic data points to evaluate programs”. He says that the main measure of a title’s impact is in an “adjusted view share”, an “efficiency score”, and “impact value”.
There’s a lot of secrecy about what goes into calculating that score, however, but here are three examples that Bloomberg gave:
- Dave Chappelle’s special “had an impact value of $19.4 million and an efficiency score of 0.8X” and an adjusted viewer share of 12.
- Bo Burnham’s Inside has an efficiency score of 2.8x and an adjusted view share of 10.
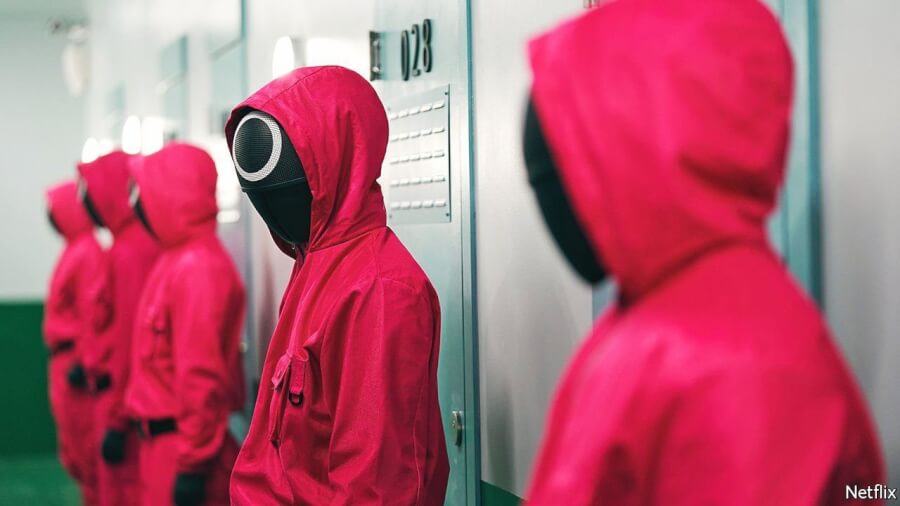
- Squid Game had an adjusted view share of 353 and an efficiency score of 41.7X. It had nearly $900 million in “impact value” compared to the $21.4 million it cost to produce.

Squid Game – Picture: Netflix
Again, what drives that exactly is not entirely known. The article states that even things like whether a subscriber is new to the service can drive up the number or whether a subscriber doesn’t watch much.
Either way, the higher the efficiency score, impact value, and adjusted view share, the higher chances of getting renewed.
What data drives renewals/cancelations that we can track
Unlike years prior, there’s now a plethora of data that’s made public by Netflix or available via third parties that can help us guess renewals and cancelations.
Completions on Netflix Are Important for Renewal
Completion data is another huge thing when it comes to cancelations. After all, First Kill showrunner cited that as one of the main reasons the show didn’t get a second season (in addition to marketing).
Digital I, a British SVOD data analytics company, provided What’s on Netflix with some data and insights they’ve seen regarding completion stats.

Completion stats for First Kill on Netflix
For First Kill, the show had under 45% of people who started episode 1 to finish episode 8. That’s compared to a show like Heartstopper, which had a completion rate of around 75%.
A rep for Digital I told us that “Historically, under 50% almost always leads to cancellation,” adding top recent shows in terms of high completion rates included Stranger Things, Lincoln Lawyer, and Welcome to Eden. All three of those shows were renewed for future seasons.
Netflix Hourly Data Can Often Hint Towards Renewal/Cancelation
Netflix top 10s have evolved over the past two years since they were added and the latest iteration of the tool has introduced weekly hourly data via the Netflix Top 10 site. Every week, they reveal the top 10 titles in four categories (Films in English and Non-English and shows in English and non-English). For those 40 shows and movies, they give us a number on how many millions of hours were watched.
That data has provided us with insights into how a show rises and falls, and from what we’ve seen, weeks 2 and 3 are often the most important for a show’s survival.

Cowboy Bebop got an unusually fast cancelation
Big drops of around 60% or more in week 3 often means that it’s unlikely that shows will return. Cowboy Bebop suffered a 59% drop from weeks 2 to 3 and First Kill had a 62% drop in week 3.
These big drops no doubt tie into the completion data we cite above.
As a quick plug, you can browse through all the top 10 hourly data with graphs and percentage drops via our search tool.
External Factors That May Drive Renewals
There are no doubt external factors that can aid a show’s renewal and Netflix themselves have even in the past cited trackers like Google Trends when talking about the success of their shows.
Websites like Google Trends, IMDb and even social media can give you an idea about how popular a show is. There’s even a huge industry of companies tracking “demand” and other factors like Nielsen, Parrot Analytics, and Whip Media, to name a few.
We hope that sheds some light on what it takes to get a show renewed or canceled on Netflix.


