


Pictures: Netflix
Does Netflix have a sophomore season problem? Following a major Bloomberg report—alongside my own coverage at Netflix and Chiffres and here on What’s on Netflix—the trend of season-over-season viewership drops certainly looks like a growing crisis. This narrative has only been fueled by frankly disappointing second-season numbers for former hits like Beef, The Four Seasons, Avatar: The Last Airbender, and A Man on the Inside. But do these figures tell the whole story, and is this strictly a Netflix issue? Furthermore, do the solutions proposed by a chorus of armchair experts regarding weekly episodes on social media actually hold water? Here is our massive deep dive on the issue and why there might be more to the story.
This trend has led analysts and commentators to ask: why are Netflix subscribers abandoning shows after their first season? The truth, at least when it comes to Season 2, is that subscribers are abandoning them during their first season—a reality that Netflix’s own viewership numbers often obfuscate. This drop-off isn’t solely about the binge-release model, long delays between seasons, or a lack of engagement. Instead, it is largely a byproduct of Netflix’s immense scale and its specific reporting methods.
Should Netflix be listening to the hordes and adopting weekly releases? Faster schedules? Or does Netflix know what it’s doing? Let’s dive in.
The “Views” Metric’s Shortcomings, Explained
Every week since June 2021, Netflix has been steadily sharing actual viewership numbers for its Top 10 most-watched titles, first in hours viewed, then in “Views,” which basically takes the hours viewed and divides them by the total runtime of a program.
Let’s take a program that did 100M views in its first 4 weeks, as announced by Netflix in its weekly Top 10. This means the program generated enough viewing hours to be equivalent to 100 million complete viewings, but we are missing a crucial piece of data that Netflix does not share: the distribution of these viewing hours over the duration of the program and, in the case of a series, per episode.
With Netflix’s binge-release model, one thing is certain: the most-watched episode of a series is inevitably the first one, the episode that starts when anyone sees the thumbnail and clicks “Play.” The most-watched minute across all seasons of binge-released Netflix series is necessarily the first minute of the first episode.
No one accidentally stumbles upon the fourth episode on Netflix. There are no linear channels within Netflix that would allow for such happy encounters with a series. Everyone, all 325 million subscribed Netflix accounts (and the 800 million users worldwide), follows the same path: they start with the first episode.
What they do next differs depending on the series: some watch all episodes quickly, others watch one per day or one per week, and finally, some stop after one, two, or five episodes for various reasons: a lack of interest, personal obligations that prevent them from watching an episode and lead them to drop out, a crying baby, or simply no longer feeling like continuing. In short, hundreds of possible and imaginable reasons lead to an inevitable result: every season on Netflix necessarily loses viewers episode after episode. This is logical.
Netflix’s “Views” metric does not show this erosion within a season. Yet, it is crucial because two series with the same number of views can have vastly different audience erosion patterns throughout the season.
Let’s take the example of two series that each achieved 65 million views after 4 weeks. On paper, these two series therefore have the same audience, but 65 million views can mean two very different outcomes; for example:
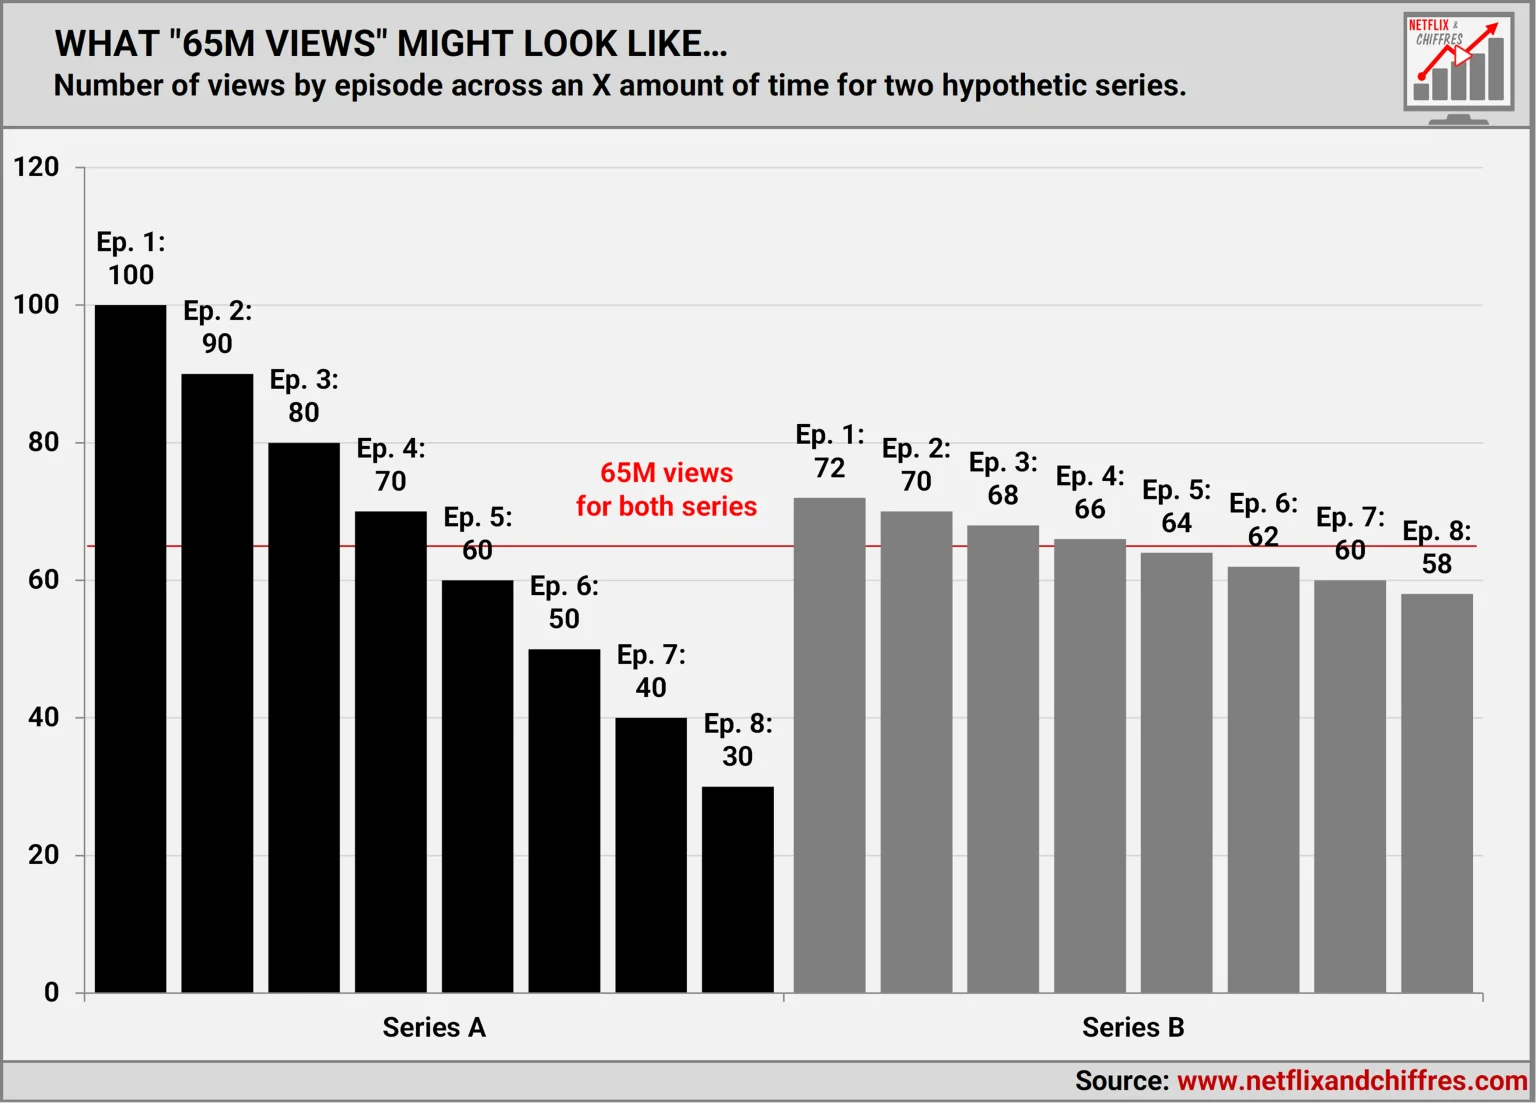
The two hypothetical series both achieved 65 million views, but one lost 70% of its initial audience while the other lost only 20%. Consequently, a potential Season 2 of Series A would start with a potential pool of only 30 million viewers, whereas Season 2 of Series B would begin with a potential pool of 58 million. It is precisely this differential that we see playing out in the disappointing viewership numbers of recent second seasons.
While Netflix does not publish per-episode viewership data for its scripted series, it readily does so for certain live daily or weekly shows in its Engagement Reports, published every six months, which reveal the viewership (in “Views”) of 19,000 programs.
The live show Everybody’s Live With John Mulaney aired for 12 weeks. Its viewership data shows that the first episode was by far the most-watched, with 1.6 million Complete Viewings Equivalent (CVEs or “views”), while the second episode lost two-thirds of its audience before stabilizing roughly until the end of the run. The gap between the first and the last episode remains at -75%.
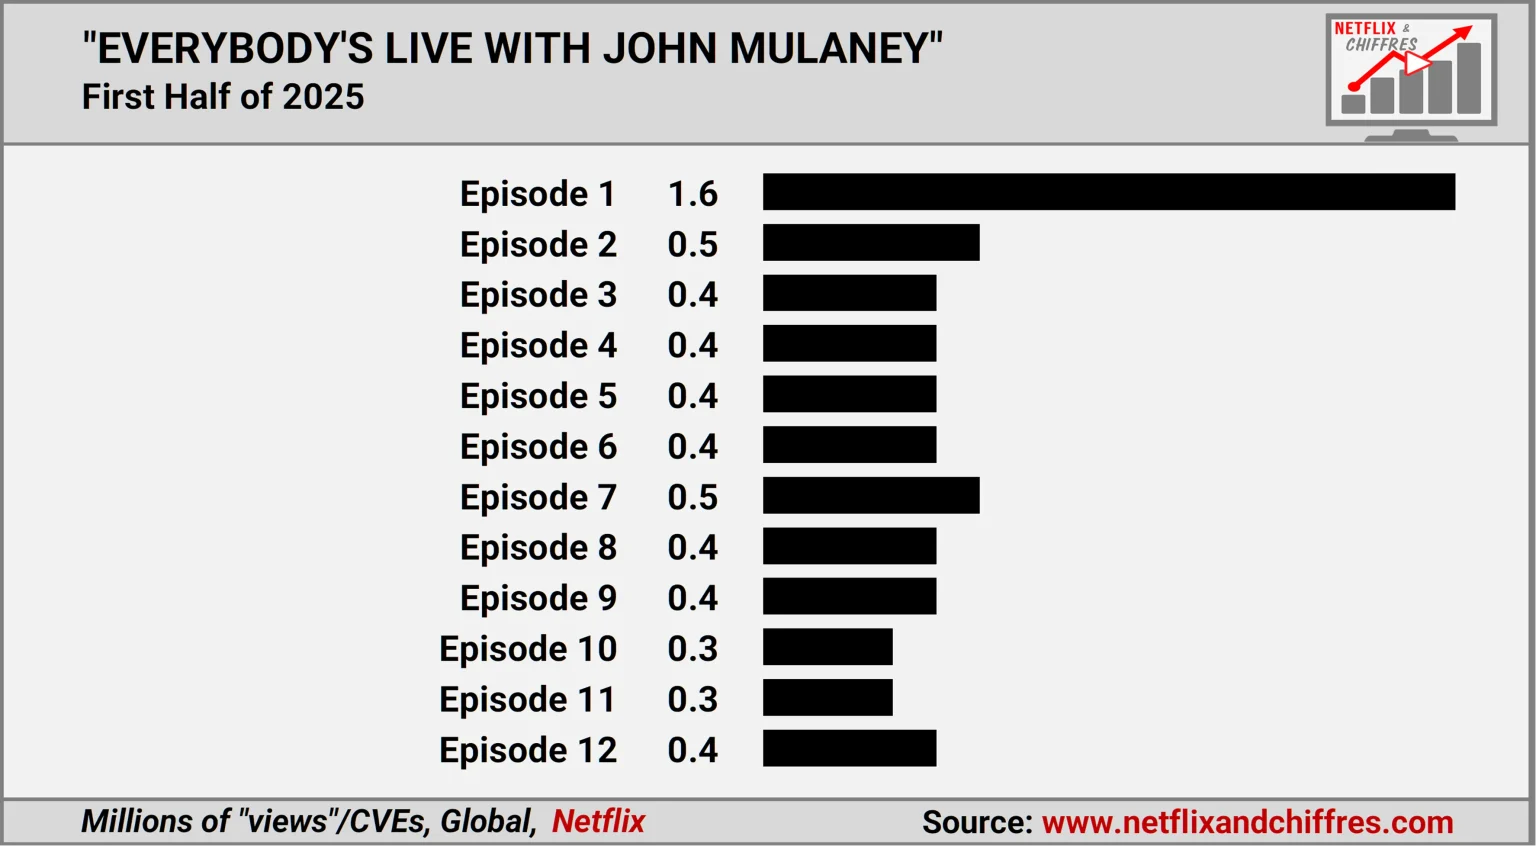
If Netflix had reported viewership for the entire season, we would have seen a figure of 0.5 million views.
Another live show, Pop The Balloon, aired on a weekly basis. Here, too, the first episode achieved the highest viewership with 3.4 million views, while the season finale totaled only 0.6 million. That is a massive drop of 82%!
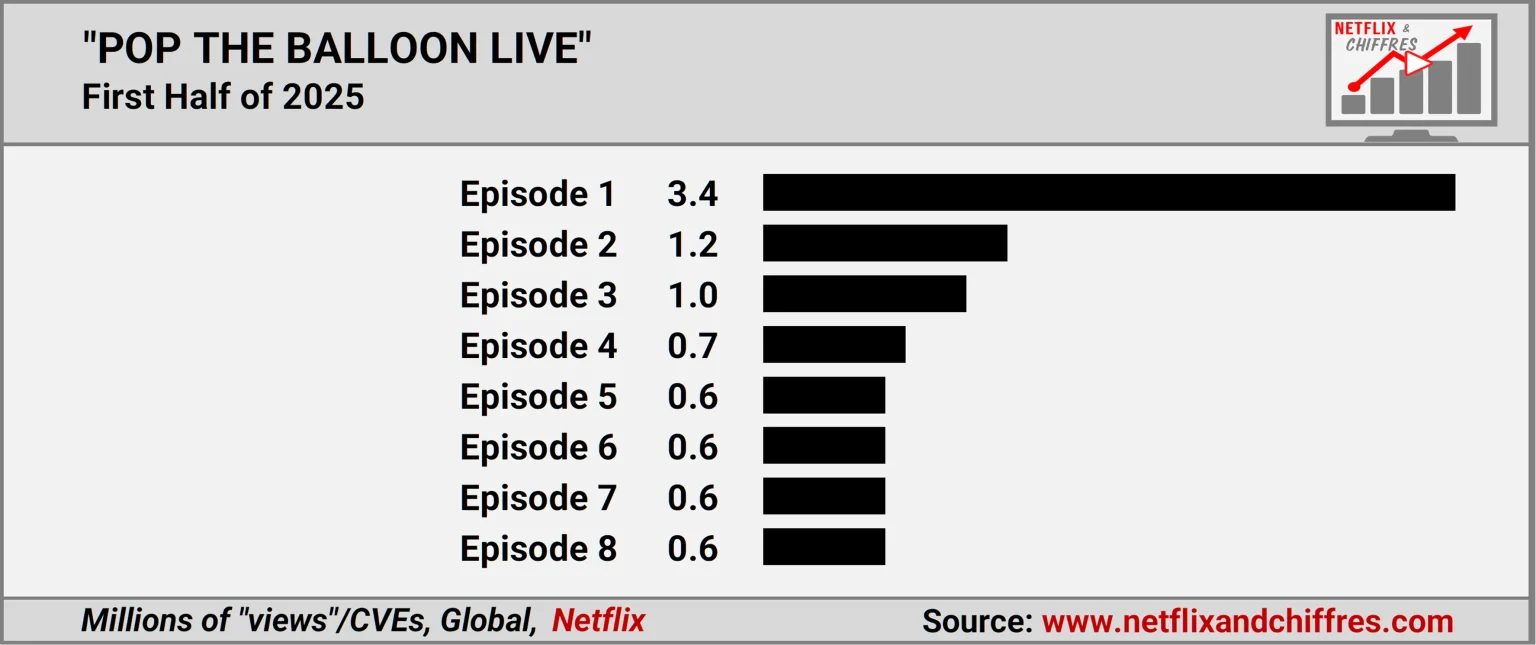
If Netflix had reported viewership for the season, it would have cited 1.1 million “views.” However, this figure would represent neither the audience of the first episode nor that of the last. Although it averages twice as many “views” as Everybody’s Live with John Mulaney, the respective final episodes of both shows are not so far apart in terms of actual viewership.
Finally, let’s look at Dinner Time Live With David Chang, which managed to maintain its initial audience for three episodes before dropping drastically, yet stabilized until the end.
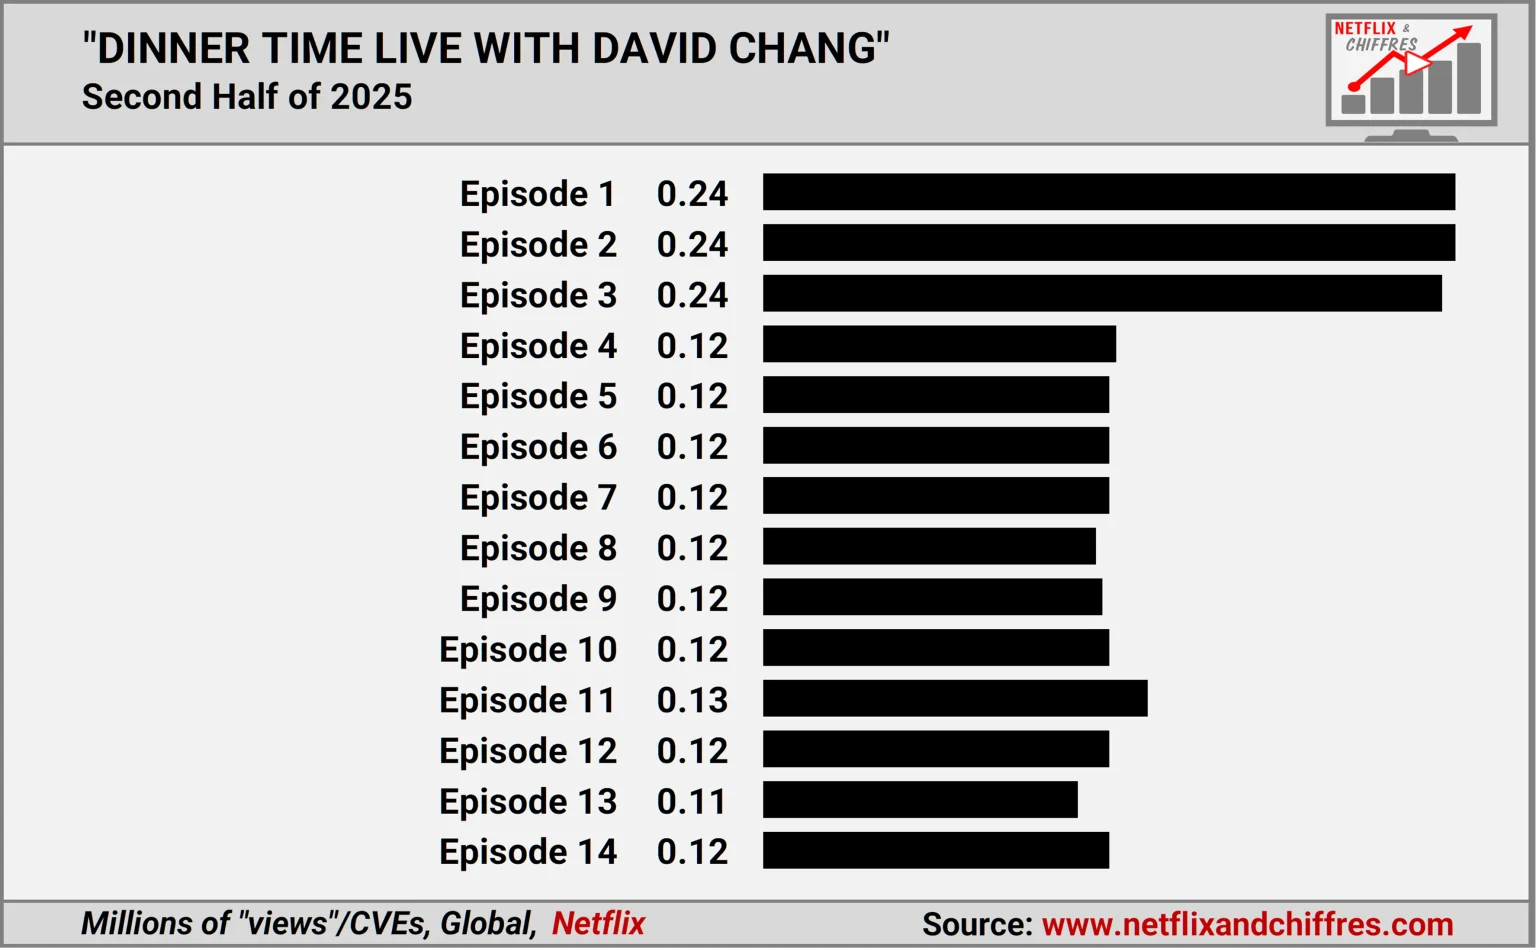
All this to say that Netflix’s “Views” metric is useful, but it has a significant blind spot. I am convinced that we would find similar viewership curves for every single Netflix series if the data were available because it’s only logical to think that every episode loses viewership.
Season 2 Is a Referendum on Season 1
Therefore, in my view, Season 2 performance is simply a reflection of the audience erosion that occurred during Season 1. If Season 1 was well-received and maintained its audience throughout its episodes, it should be able to start Season 2 on solid footing. Conversely, if it failed to sustain interest during its first run, Season 2 results will inevitably suffer.
I have compiled the performance data of second seasons for major US Netflix series released in recent years compared to their first seasons, and here is what we find:
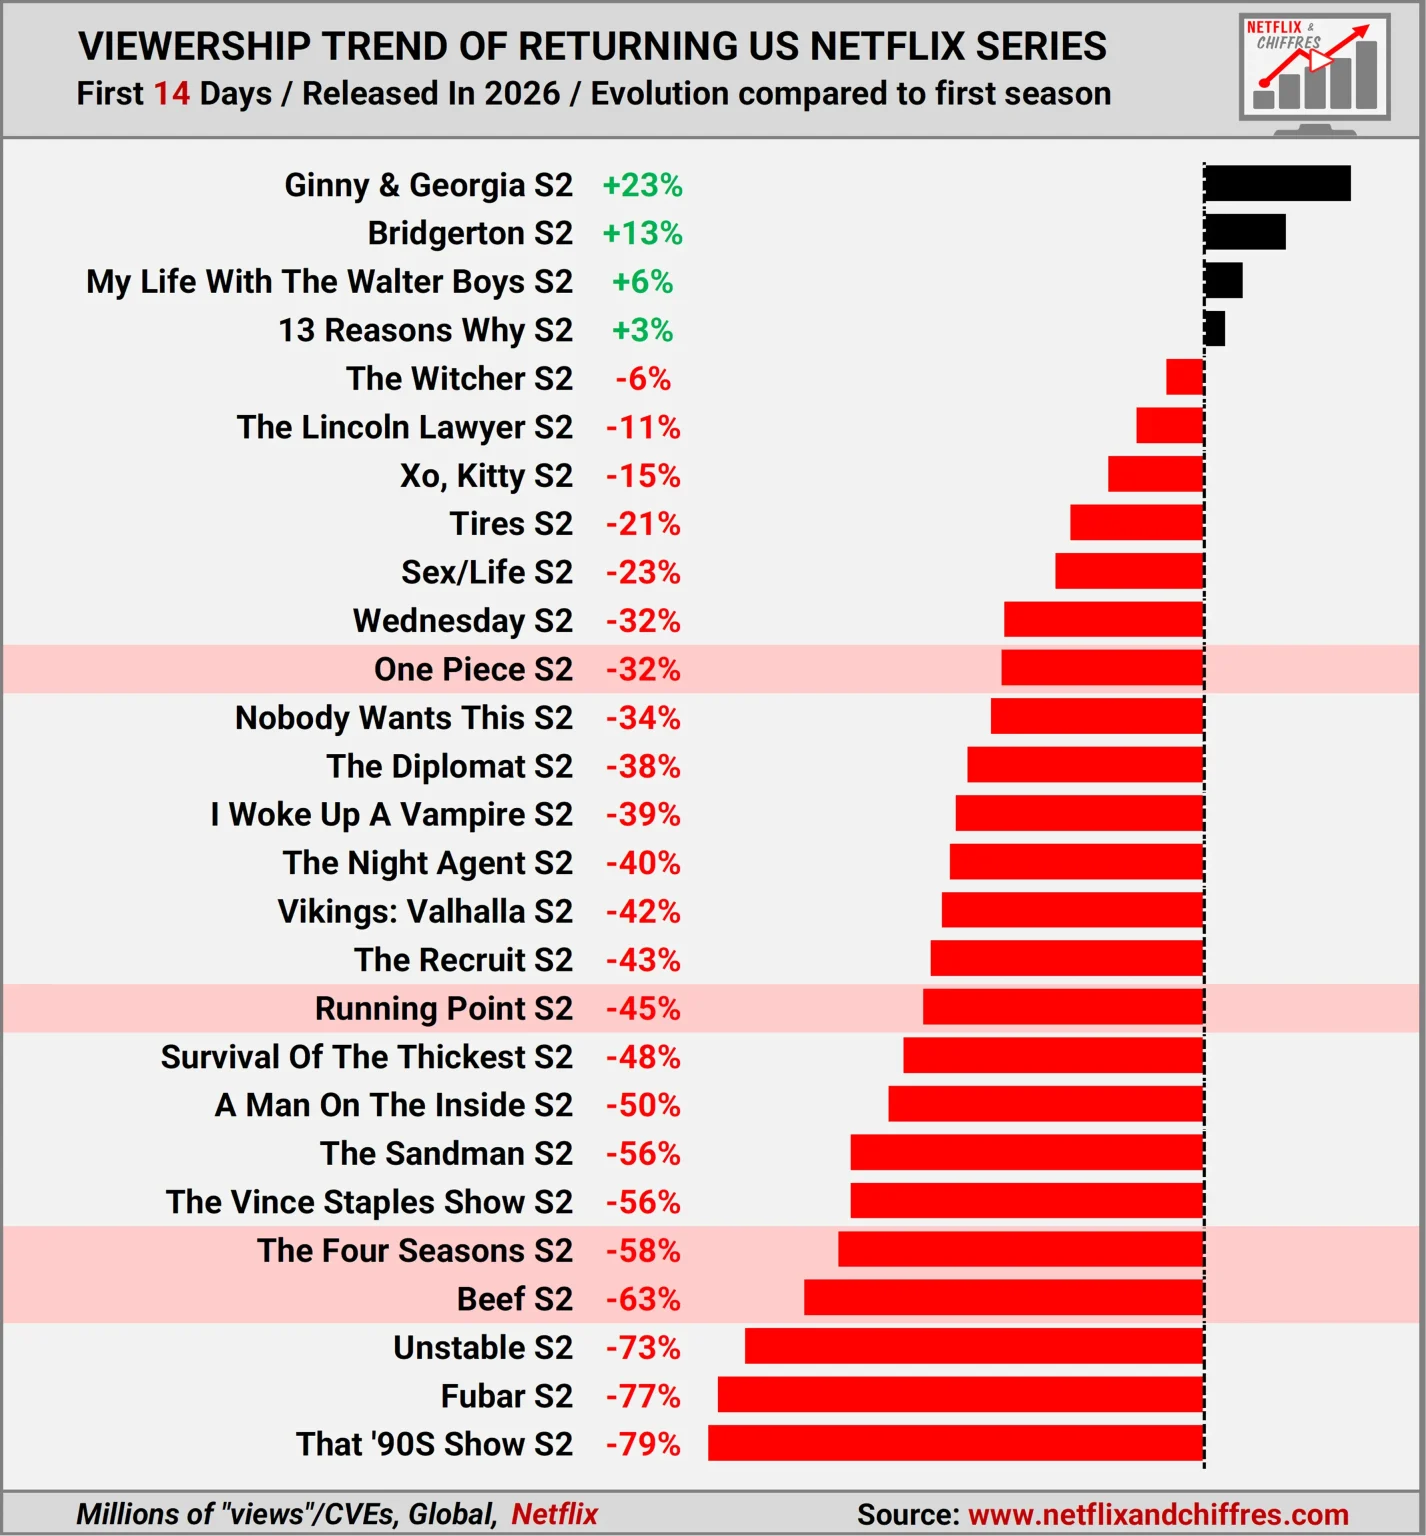
Let’s look at a few examples:
- That ’90s Show: This is the sequel to the iconic 90s sitcom That ’70s Show. Based on its title alone, it likely attracted many curious subscribers, but the series probably didn’t do enough to keep them hooked.
- FUBAR: This is Arnold Schwarzenegger’s first series, and his face is prominently featured on the thumbnail. Naturally, this likely drew in curious viewers initially, but the disastrous Season 2 figures suggest that these curious viewers probably left very quickly.
- Beef: This series is an anthology, meaning the seasons are independent of one another. Season 1 achieved honorable ratings, but viewers clearly understood it was a limited series. Naturally, when Season 2 arrived with new characters and a new story, audiences evidently felt no need to return since the original story was concluded. Sometimes, Netflix distinguishes anthology seasons with separate thumbnails and pages on the service, as seen with Ryan Murphy’s Monster or The Chestnut Man. In the case of Beef, however, they did not do so.
- Ginny & Georgia: This series actually grew between Season 1 and Season 2, proving that such a trajectory is possible. How is this miracle achieved? It’s quite simple: one can assume it experienced very low episode-by-episode erosion, and then, between the releases of Season 1 and Season 2, other subscribers discovered the series, enjoyed it, watched it through to the end, and thus added themselves to the potential audience pool ready for Season 2. The time gap between the two seasons therefore worked in the show’s favor, allowing it to accumulate more fans. A similar dynamic undoubtedly occurred for Stranger Things, Bridgerton and for any series that actually managed to grow its viewership between two seasons. When the quality resonates with the potential audience, that audience not only stays but grows as the total number of Netflix subscribers increases.
Netflix’s Audience Gives Everything a Chance but Is Also Very Fickle
To minimize erosion within a season, Netflix already employs the best recipe: the binge release. Having all episodes available at once helps reduce this erosion as much as possible. However, in a service where a dozen new series are released every month, Netflix subscribers have likely learned not to waste their time on a show if it doesn’t appeal to them right from the start.
To illustrate this, let’s revisit two medical series released last year: Season 1 of The Pitt on HBO Max (released weekly) and Season 1 of Pulse on Netflix (released via binge). The former was a phenomenon and was renewed, while the latter was canceled. One might assume The Pitt drew a much larger audience than Pulse, but according to per-episode data from Luminate in the US, collected by the newsletter Ted on TV, this is not the case, at least not over the first 28 days.
Pulse launched with 9 million views in 28 days for its first episode, dropping to 7 million for Episode 2, and then to just under 6 million for Episode 3.
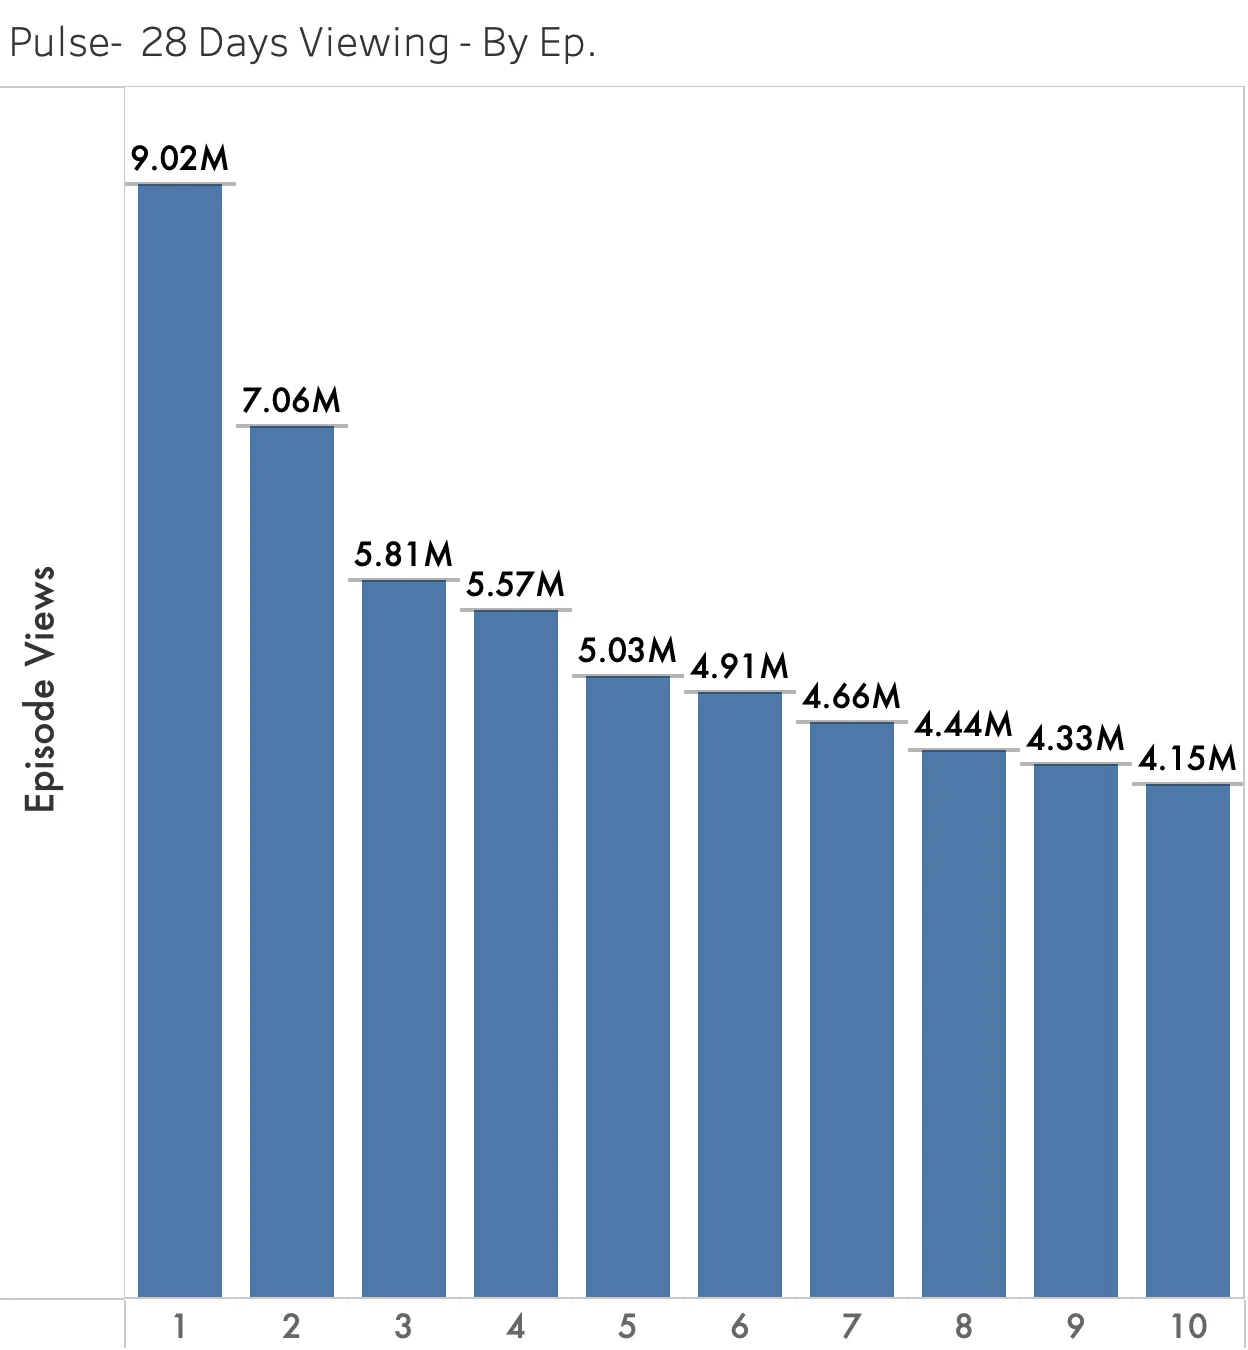
This clearly shows the harsh filtering of curious viewers over the first three episodes, followed by a slower erosion throughout the remaining episodes, leaving only the converted fans. Between Episode 1 and Episode 10, the series thus lost more than 50% of its audience.
For The Pitt, the situation is slightly different due to its weekly release over 14 weeks; just look at the figures.
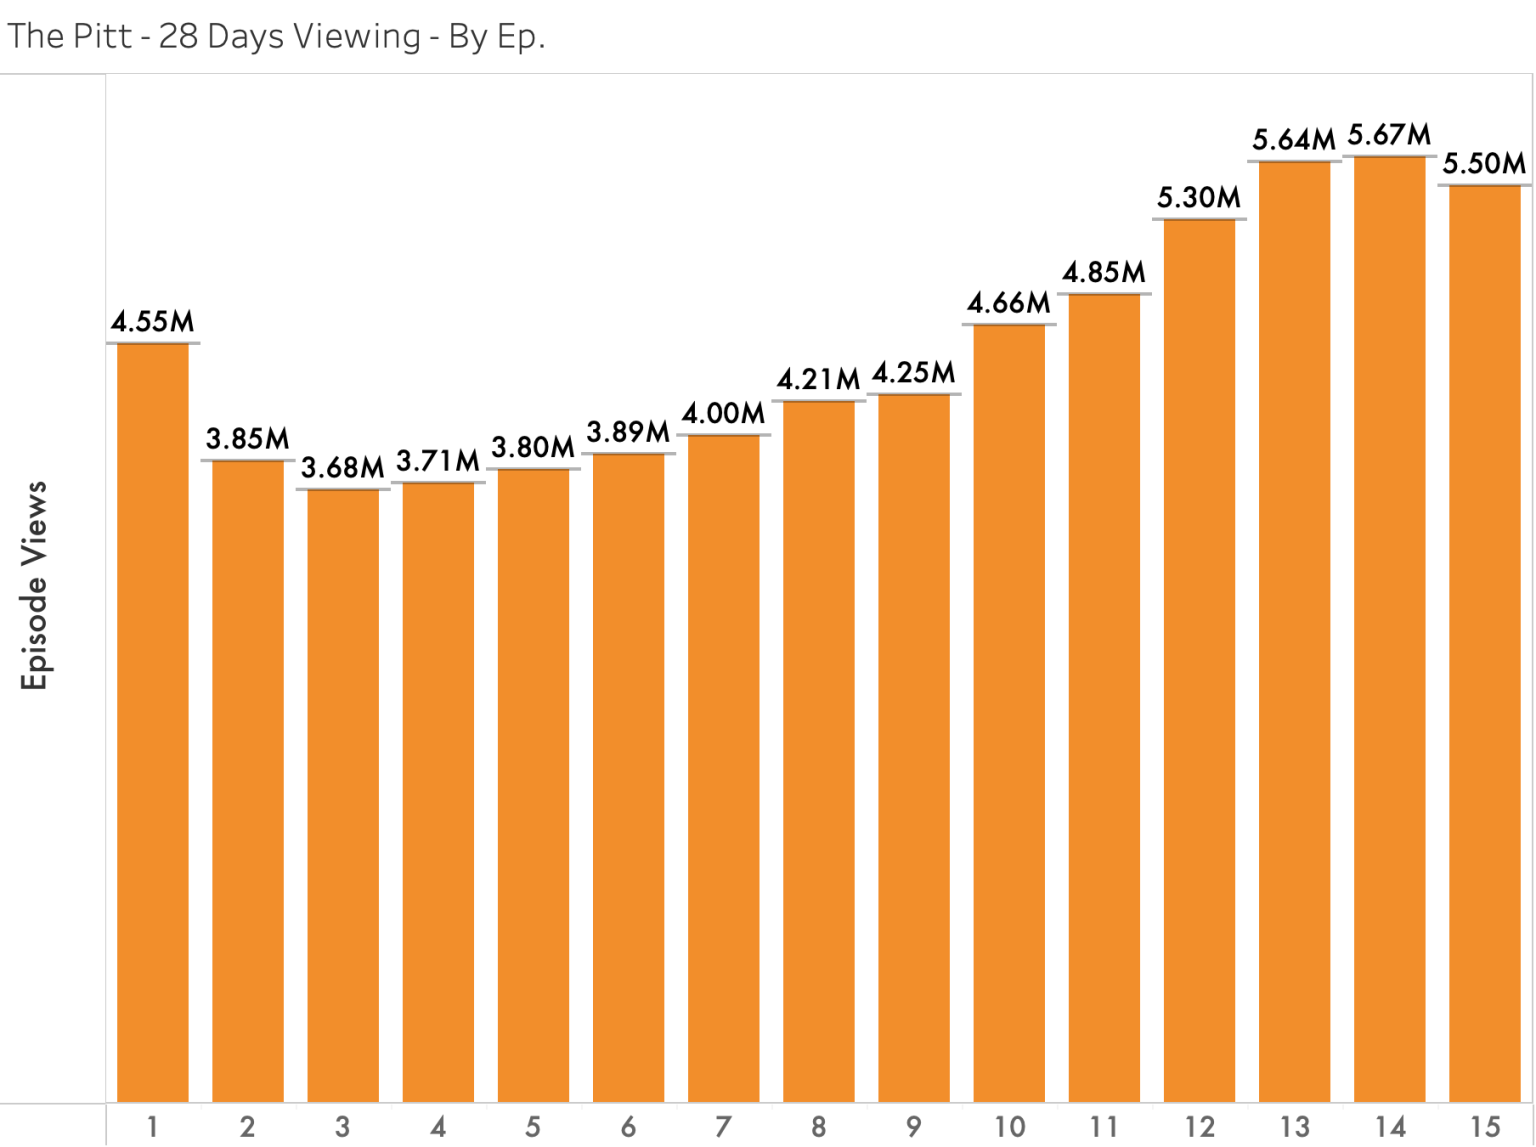
The 28-day metric creates a false impression of episodes gaining audience, but this is somewhat misleading. Since the series aired over 14 weeks, the graph only displays the first four weeks of viewership for each episode. Still, looking strictly at the raw numbers, the most-watched episode of The Pitt within its first 28 days achieved at best 65% of the audience of Pulse‘s most-watched episode over the same period. Yet, one was renewed and the other canceled because their trajectories were fundamentally different, especially when a potential Season 2 must build upon Season 1’s audience base.
Some have attributed The Pitt‘s success to its weekly release schedule, but it is more likely due to the consistent quality of the show (unsurprising, given it was produced by the same team behind ER, a series that ran for fifteen seasons). However, when quality falters, audiences drop regardless of the release schedule, weekly or otherwise. Consider the US viewership of Heroes twenty years ago. It was a massive hit in its first season before declining episode after episode, despite the weekly release format and the several-month gaps between episodes.
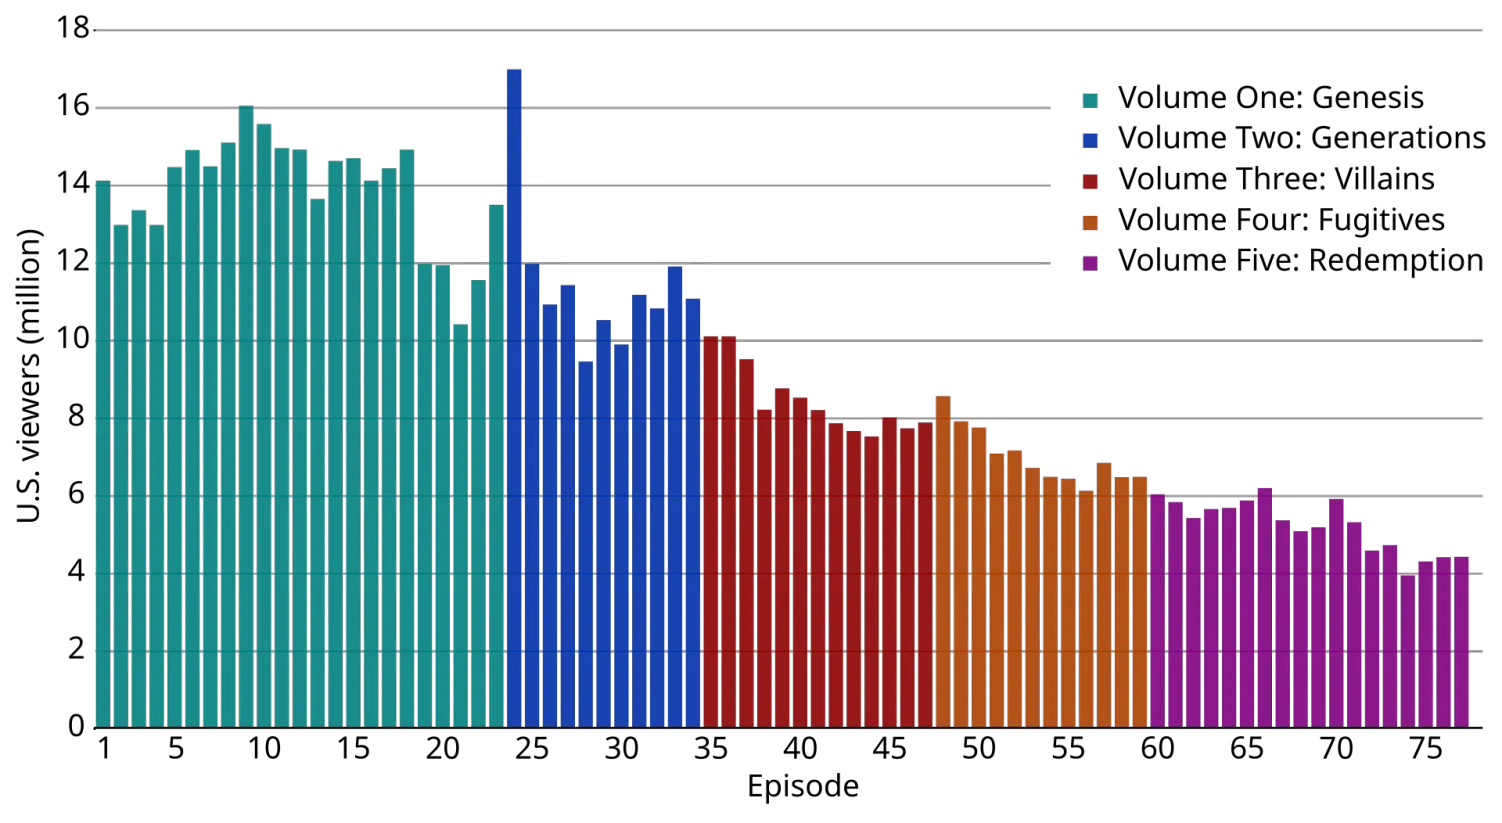
This is a pattern found in many series, even though a few exceptions manage to grow over their first two or three seasons—or even eight, if we consider Game of Thrones (although, again, more people watched the first episode of Game of Thrones over time than its last). This is natural and logical.
If we examine the performance of recent weekly streaming series (using Luminate data from the US), an interesting trend emerges. All series adapted from existing universes, such as Star Wars, the MCU, Percy Jackson, or Halo, have lost audience, to varying degrees, in their second seasons.
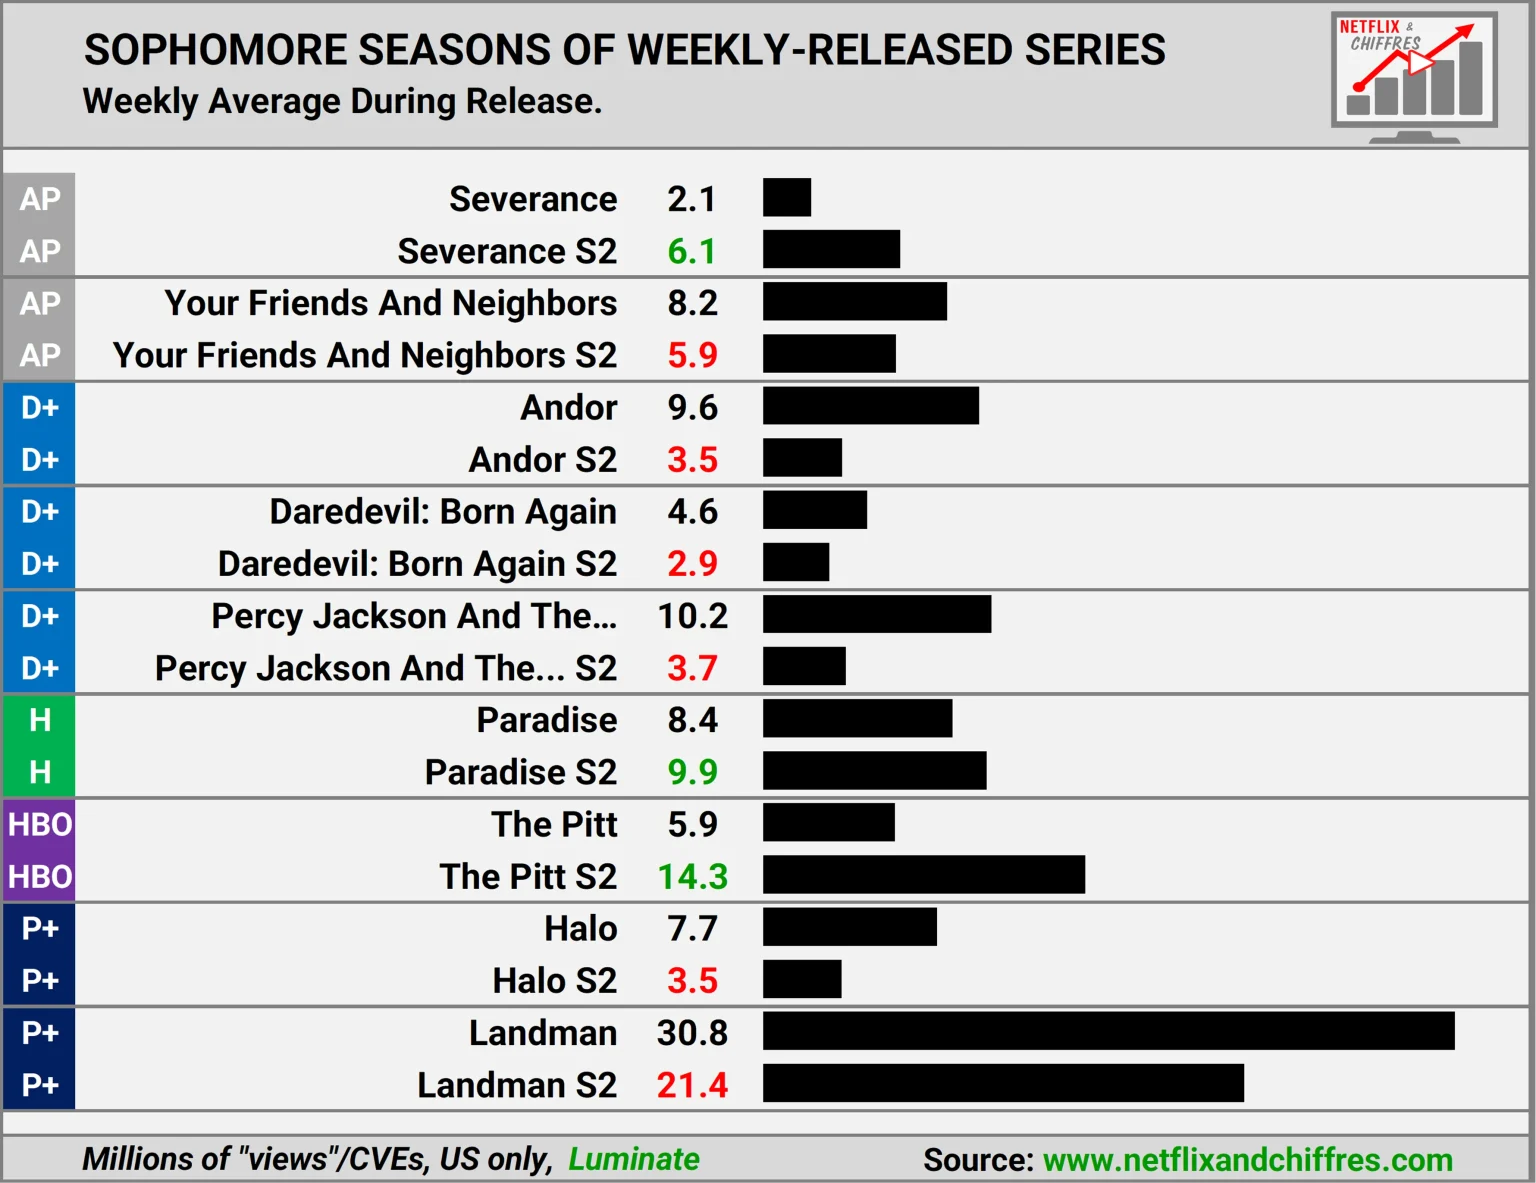
Those that are growing (Severance, Paradise, The Pitt) are all original series that started modestly before exploding in popularity. An original universe has a better chance of attracting newcomers than an established one, which immediately draws in fans and connoisseurs alongside the general public, only to lose them more or less quickly thereafter.
All of this is amplified on Netflix, with its 325 million paid subscriptions and 800 million users. In my view, this is not a question of quality or release format, but rather of an audience that tests and tries content outside its comfort zone, yet ultimately shows little sentimentality when it doesn’t like something.
A Look at the Past to Understand the Present
Another strong indicator of this season-over-season erosion can also be found in the Engagement Reports. The category of programs that interests me here is that of older Netflix series that have long since ended.
This is interesting because we are looking at programs with multiple seasons available immediately, with no waiting period. Yet here too, we observe a more or less pronounced erosion between seasons.
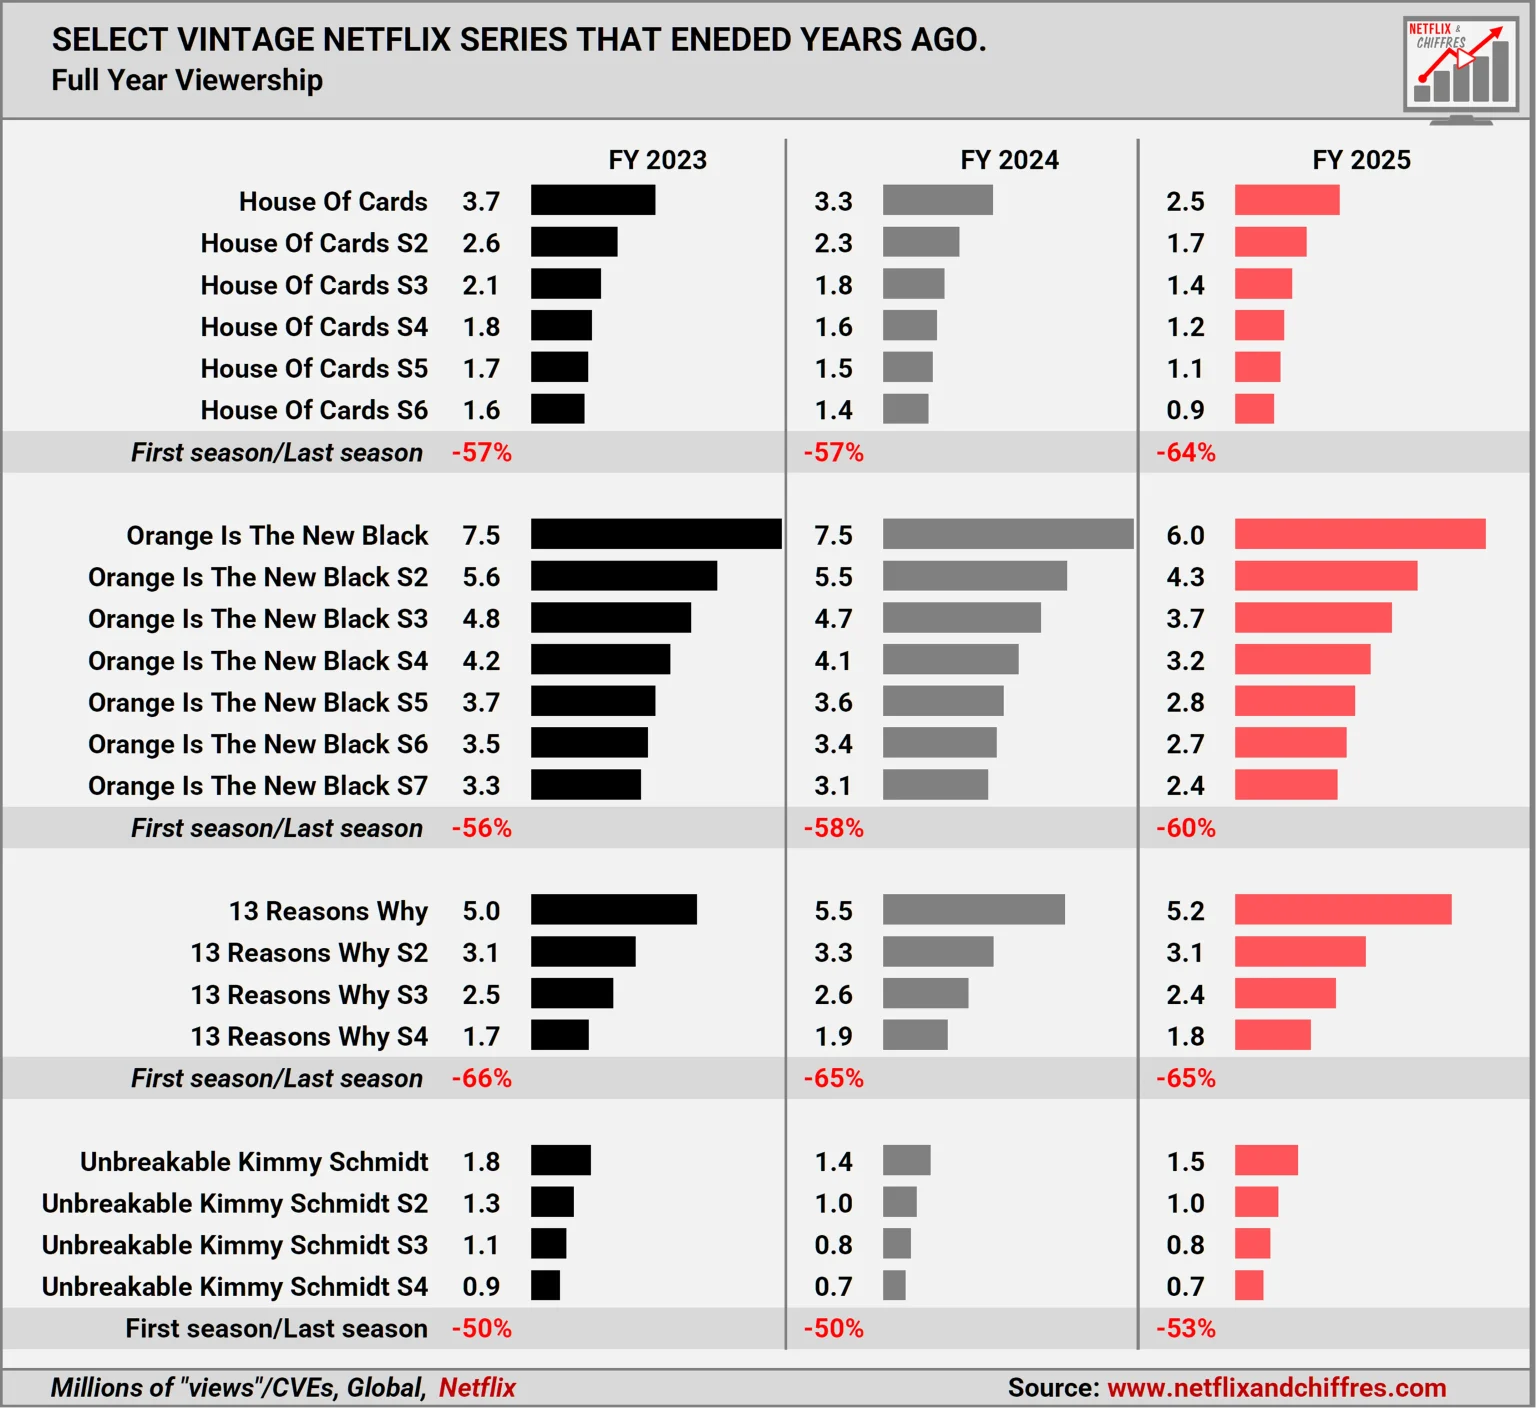
I took House of Cards, Orange Is the New Black, 13 Reasons Why, and Unbreakable Kimmy Schmidt as examples. All of them lost at least half of their audience between their first and final seasons, with a steeper drop between Seasons 1 and 2, followed by more moderate declines in subsequent seasons.
This pattern is also evident in current series, with an average drop of 35% between Seasons 1 and 2, 6% between Seasons 2 and 3, and 9% between Seasons 3 and 4 among the data I have. Season 2 sheds the curious viewers from Season 1, and the erosion continues at a slower pace in the following seasons.
Some Other Suspects
This does not mean there are no other suspects to blame for the underperformance of recent second seasons. Personally (though I cannot prove it), I do not believe the wait between seasons is such a significant factor. Series like Bridgerton or Stranger Things have shown that regardless of the gap between seasons, if a show is cherished by its core fanbase, they will be there from the first week. It is likely a factor for moderately appreciated, average series, but true fans always show up. You just need to have enough of them.
Others have pointed to a lack of marketing (I doubt this as well, as I do not believe Netflix stayed silent on the release of the new season of Avatar: The Last Airbender, for example), but Netflix has the most-prized billboard with its homepage.
I have one last potential suspect, also without irrefutable proof: Netflix’s new TV interface. Its implementation was quite difficult, with many users questioning its usability and noting that fewer titles were visible at first glance. The effects of this rollout are very hard to assess, but if I had to bet on an accomplice in addition to the main culprit mentioned here, this is the one I would charge. Or maybe it did work too well, attracting way more curious people than it should have, hence creating a bigger drop-off for series. It could go both ways.
Conclusion
Does Netflix therefore have a Season 2 problem? In my view, no. The “sophomore slump” is primarily a statistical artifact and a consequence of Netflix’s sheer size.
It is a statistical artifact because the “Views” metric masks the natural erosion that occurs episode after episode within a single season—data we do not have access to. This metric smooths over reality by equating an artificially inflated start with actual retention, creating the optical illusion of a “sophomore slump.”
It is also a consequence of Netflix’s size because the first season acts as a funnel, attracting a vast audience of curious viewers (drawn by marketing, casting, or prominent placement within the service) from among its 325 million subscribers, a significant portion of whom drop out along the way. Consequently, Season 2 does not start with the same potential as Season 1, but only with the remaining “core target,” the viewers who actually completed Season 1.
The decline in Season 2 is the direct reflection of this internal erosion within the first season, rendered invisible by the platform’s “Views” metric. The real issue may lie in the fact that Season 1 often fails to convert curious viewers into loyal fans, but given such a massive volume of users, is that even possible?