Quantity vs quality. That’s a phrase you’ll often hear when Netflix is compared against its competitors and a phrase you’ve no doubt heard since Netflix’s Q1 2022 quarterly earnings. Is there merit in the criticism? We’re thrilled to welcome Frédéric from Films de lover to dig through the data.
This article was first published in French in a newsletter called “Netflix and Chiffres” in which I talk about everything Netflix and streaming related, but with graphs.
Overview
Let’s start with an overview of the evolution of the number of Netflix Original films and series released between 2013 and 2021 and the evolution of their average IMDB rating over the same period of time.

Netflix Original movies and shows added to Netflix over time with IMDb average.
What’s the take-away here? Hard to say.
The average rating of Netflix Original films released between 2015 and 2021 oscillates between 5,84 and 6,05/10, whether Netflix releases 3 or 226 films. That’s pretty surprising to me that quantity does not have that much of an impact on the average “quality”.
The overall average rating for the 732 Netflix Original films is around 5,9/10, the average rating in 2021. Could it be better? Sure. Is it worse than before? I don’t find the data conclusive but you might disagree.
When it comes to series, it has been relatively the same average for the last four years now, during when Netflix started to release a lot of series. The overall average rating is 6,999/10 (you can round it up to 7/10 if you want) and that’s more than in 2021.
So we could look at that chart and conclude that the overall quality of Netflix shows and films stagnates or decreases but it might be more complicated than that.
Netflix Original Movies Quality vs Quantity (2015-2021)
For reference, here’s how this breakdown of the scores work:
- 8+ Average rating: Excellent
- 7.5-7.9 Average rating: Very good
- 7-7.4 Average rating: Good
- 6-6.9 Average rating: Correct
- 5-5.9 Average rating: Mediocre
- 0-4.9 Average rating: Bad.
Let’s see how the films spread on a scatter chart.

Scatter graph of IMDb ratings for Netflix Original movies released
Netflix releases a lot of films. A lot. And that shows on that graph.
We can also see some interesting trends, especially in 2021 with a clear scission around the 6.0 average rating and a glut of films in the mediocre region. If we take a look at the raw numbers though, something different starts to appear.
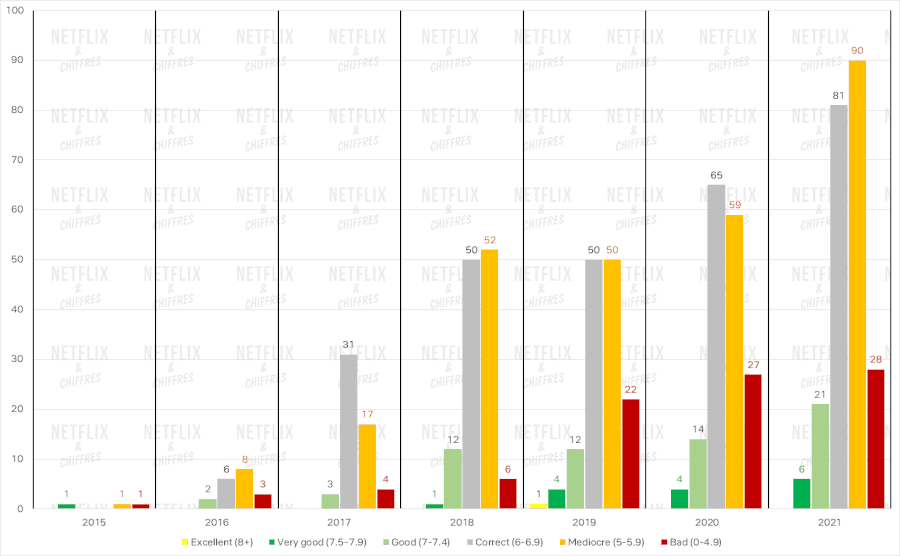
This graph shows the biggest Netflix paradox of all.
Are there more bad Netflix Originals films than before? Yes, there were a record number of 118 mediocre or bad Netflix films in 2021 if you count in raw numbers.
Are there more good Netflix Originals films than before? Yes too, there were a record number of 27 good to very good Netflix Originals films in 2021 if you count in raw numbers and a whole lot of decent films too in the middle.
Some might say that you’re bound to have a lot of good titles when you release 200+ films a year and it might be true or not.
Ultimately, what matters more? Does having more good films that you can boast about individually or having a better percentage of good films per year that will reinforce a good perception of the brand? Hard to say.
Netflix Original Shows Quality vs Quantity (2015-2021)
Let’s now take a look at how Netflix series fare compared to Netflix movies.
As a quick aside, we’ve generally noticed series are usually better rated on IMDb across the board and that explains why we have a lot more “excellent” shows coming from Netflix.
Let’s take a look again at the scatter chart.

Scatter graph of IMDb ratings for Netflix Original shows released
In 2021 again, we can see a rift around the 6/10 average rating, the same as in 2019.
If we take a look at the evolution of each class of ratings, some other conclusions can be drawn.
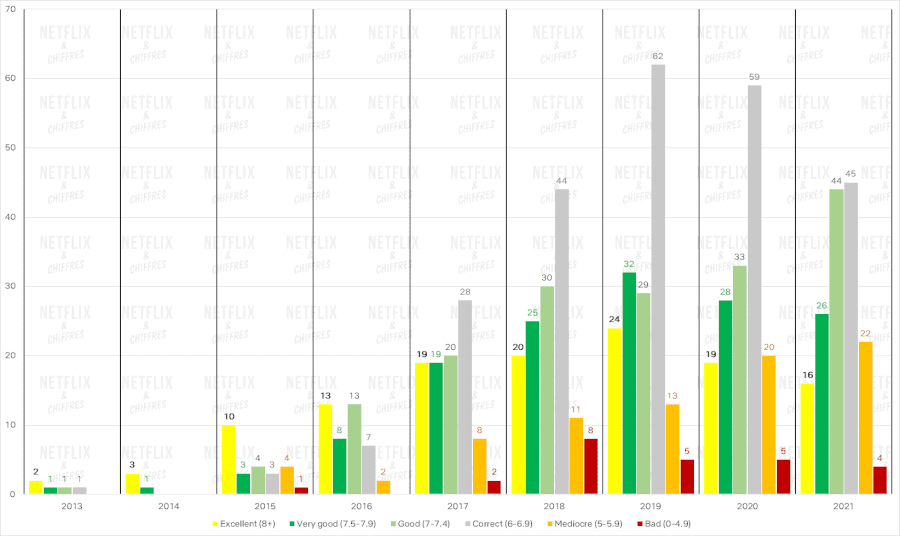
Bar graph showing the quality of titles on Netflix over time
First, there are fewer bad shows now than before, when they peaked in 2018. But there are also fewer excellent shows than before (it peaked in 2019).
The funny thing though about that is that the best-rated Netflix Original show came out in November 2021 (Arcane with a 9.1/10) and the best-rated non-animated Netflix Original show is currently Heartstopper (8.9/10) which came out in April 2022. So fewer excellent shows but the ones that are considered the best ones ever came out in the last few months.
How’s that for the “quality is getting worse on Netflix” narrative?
Does Netflix actually have a Quantity vs Quality problem?
If we had to answer the question “Are Netflix Original films and series worse than before?“, one way to look at it would be to study the evolution of the percentage of content that has a mediocre/bad average rating out of the yearly Netflix Original crop of titles.
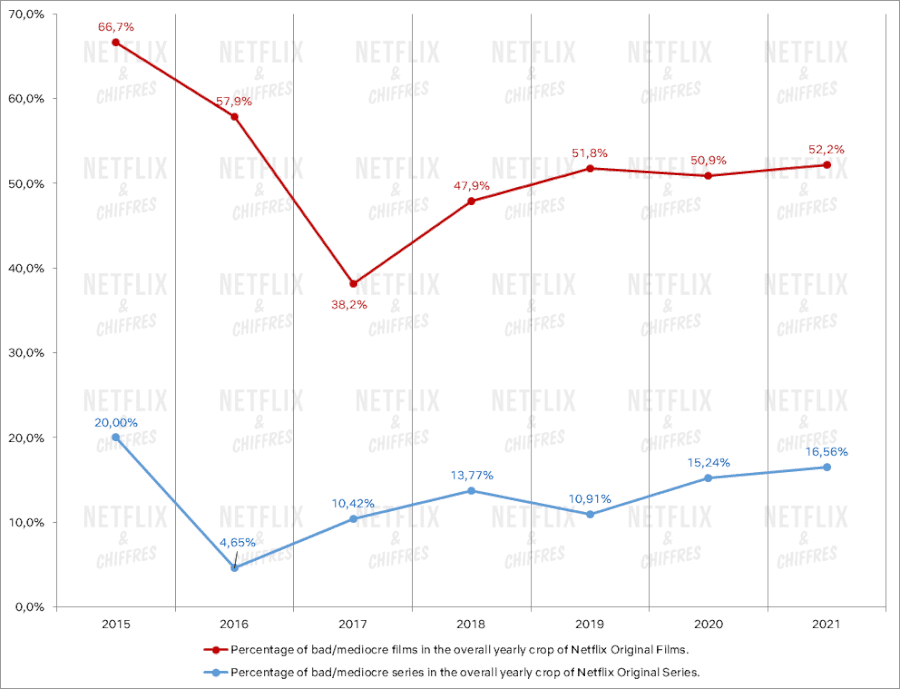
Percentage of “bad” movies and shows on Netflix per year
So, for the last three years, every film that Netflix releases have had a 50/50 chance of getting a bad/mediocre average grade (less than 6.0/10 on IMDb). That’s a lot. On the flip side, there are more and more good films too and one way to look at it is to say that those good films exist and if you were to only watch them, your perception of the Netflix brand would probably be different.
This question also has to be contextualized within the evolution of Netflix over the last ten years. Between 2013 and 2017, the perceived quality of Netflix Originals films and shows was mostly through its English-language shows.
They were its driving force at the beginning of its international expansion. But as Netflix became more and more international service, its best-rated content also became to shift from the US to other countries. For example, if we look at the best-rated 10 Netflix Original films every year, here’s what we find.

Top 10 rated movies on Netflix per year – English language vs foreign language
In 2016, 8 of its 10 best-rated Netflix Original films were English-language films. In 2021, that number dwindled to 4. We can see the same pattern if we look at Netflix Original Series.

Top 10 rated shows on Netflix per year – English language vs foreign language
In 2015, 8 of its 10 best-rated Netflix Original series were English-language shows. In 2021, only 2 of them were. Korean dramas and animated series are now the main best-rated shows on Netflix for example.
So maybe the problem is not so much about the perceived quality of Netflix Original films and series but about how this discussion seems to be focusing entirely on US films and series by US streaming analysts and media in what can only be described as a myopic view of a global market.
Sure, Netflix has dropped the ball on its US content over the last few years, mostly because the competition is fierce for talent and projects there. But what Netflix is doing internationally is something that its US competitors are nowhere near replicating.
Here are, for example, the 50 best-rated films that were released on Netflix France under the label Netflix Originals between 2014 and 2022.
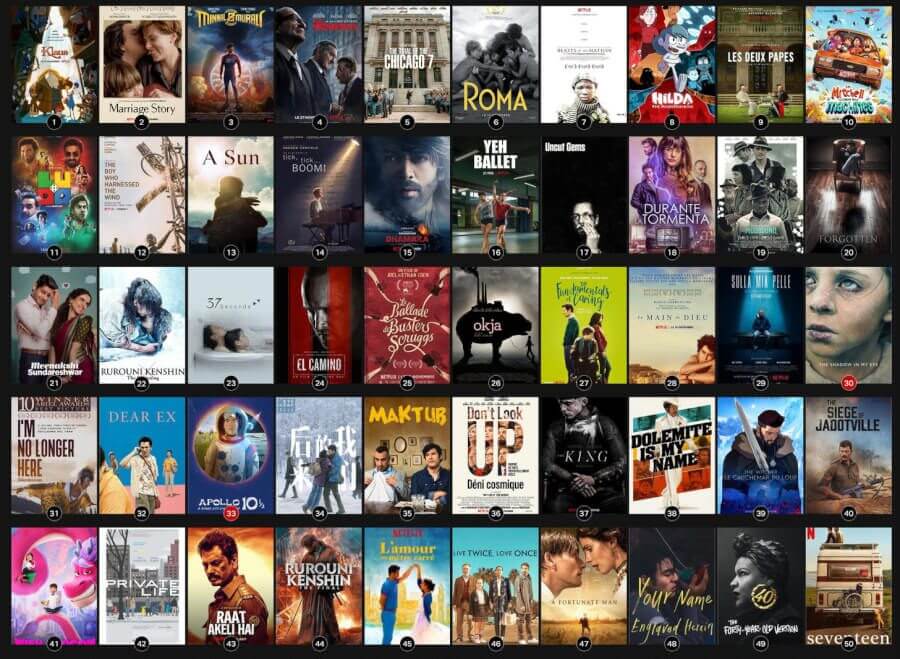
List of the Highest Rated Netflix Originals according to IMDb
Only 20 of them are English-language films but you also have Indian films, Spanish films, Japanese films, Italian films, Danish films, Korean films, and Taiwanese films. Notably, some of them are acquisitions and not true Netflix productions. But either way, they are representing the Netflix brand abroad.
I’m more and more convinced that Netflix has to create a dedicated part of its service that would showcase its best-reviewed content, based on IMDb, Rotten Tomatoes or Letterboxd ratings and not on what’s being liked on its service. The same way HBO is a seal of quality inside HBO Max, Netflix needs to showcase more efficiently its acclaimed films and series from all over the world under another label, a “gold standard” of what it can do everywhere around the globe, that would be the perfect gate for subs (new and old) looking for “quality” according to the methodology used in this analysis.
The list of the top movies and shows also showcases another strength of Netflix’s library. Most of them are not based on any distinctive or recognized IPs. That means that for each film and series, Netflix has to rely on its internal discoverability systems and more importantly on the curiosity of its subscribers to watch those films and series with no known people, coming from countries all over the world. And do that 200 times a year. For subscribers, that opens up a new world of possibilities away from IPs and cinematic universes. And they’re only one click away to go exploring it. But will they?
Disclaimer: For this analysis, IMDb was used, the world-leading TV and movies database. Primarily user ratings from IMDb were used for this piece. There are some caveats though: it’s skewed towards a US audience that can be very “passionate” about ratings, in a good way or a bad way. It’s also become a battlefield for culture wars that tend to punish woke films and series. Netflix Originals programs studied here are all the films and series released in France under the banner “Netflix Originals”. So that encompasses true productions from Netflix but also acquisitions. As a result, some titles may not be available in the US or any other country and Netflix Original titles in the US only are not included in that study. The scope of the analysis is 732 Netflix Original films and 797 Netflix Original shows (fiction, children, and animated series) released between 2013 and 2021 when applicable.