Sweet Magnolias. (L to R) Caroline Lagerfelt as Paula, JoAnna Garcia Swisher as Maddie in episode 310 of Sweet Magnolias. Cr. Courtesy of Netflix © 2023
Sweet Magnolias was recently renewed for a fourth season, but what went into the decision for that renewal? Although Netflix provides some data, thanks to other data companies, we can look under the hood to see how well the show performed, offering insights into the reasons behind its renewal.
Over the past few years, through multiple methods, we’ve been offered insight into viewership on Netflix. We’ve got data from Netflix itself through the daily top 10s introduced in early 2020 and later the top 10 website in November 2021 that gave and continues to provide us with weekly insights into hours watched for the most-watched 40 movies and shows on the service.
Through that, data from other companies, and some leaked insights from Bloomberg, we’ve been able to get under the hood on why a show gets renewed.
One of those data companies we’ve been leaning on is PlumResearch. Based out of Poland, the company uses panels of users worldwide to provide via their Showlabs platform “a precise and granular audience measurement of streaming platforms and FAST channels.”
We’ve used their data before looking into completion rates for different shows that we’ve noticed plays a significant role in renewals. This time, however, they provided some additional insights, specifically about Sweet Magnolias, which shows its evolution across the three seasons.
Before we dig in, note that this data is pulled from their United States panel.
Completion Rate Data for Sweet Magnolias
Let’s begin with the completion rate, then. By completion rate, we’re referring to the percentage of people that get from the start of the series to the end.
Below, you can see the graph for the completion rates for Sweet Magnolias seasons 1-3 spread out over three different periods:
- 7 days (the first week)
- 28 days (the first month)
- 90 days (the first three months)
These periods reflect how Netflix does or has released data in the past. In the Summer of 2023, they switched their top 10 to a 91-day metric, for example.
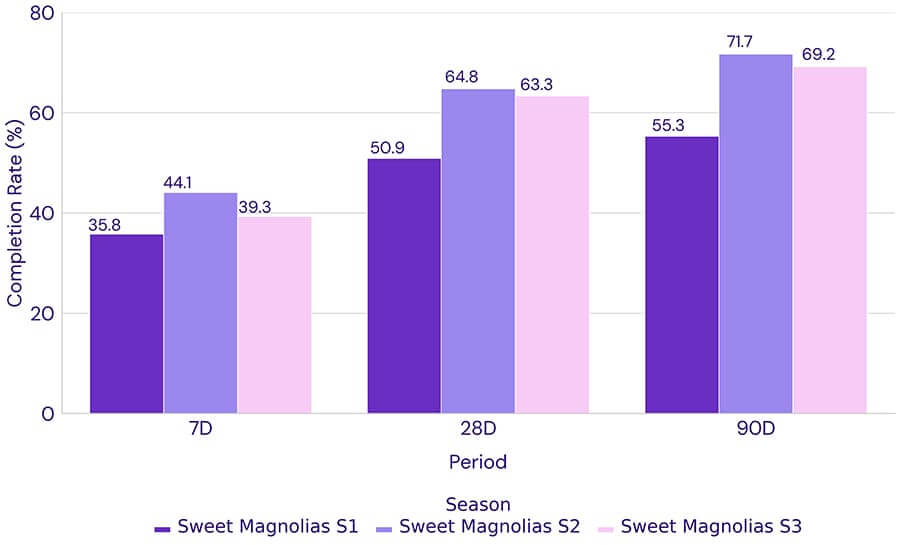
Courtesy of PlumResearch
Other Insights Into Sweet Magnolias
PlumResearch also gave us some additional insights into the show’s performance, suggesting that despite having a slightly less completion rate, the average time spent with season 3 is the highest on their panel compared to the previous two seasons. Below, the ATS refers to Average Time Spent, “the average minutes that content was viewed, which includes all views of a given piece of content by each profile for the given time period.”
| Title (Season) | Release Date | Season Episodes Number | Average Episode Duration | ATS (min) 90D |
|---|---|---|---|---|
| Sweet Magnolias S1 | 2020-05-19 | 10 | 48,7 | 270.6 |
| Sweet Magnolias S2 | 2022-02-04 | 10 | 50,7 | 374.3 |
| Sweet Magnolias S3 | 2023-07-20 | 10 | 51,5 | 384.8 |
They also provided us with even more additional stats and some of their metrics on how they measure the success of a show.
Before we show you the chart, here are a few quick explainers for a couple of the items in the table that you may not be familiar with.
“Binge Watching: this metric tells you how bingeable a TV series is. It’s the percentage of Unique Viewers (UV) who watched at least n episodes consecutively during one uninterrupted watching session. A watching session remains uninterrupted when the next episode is started within a 2-hour window from the end of the previous episode.
Get Hooked: this metric lists the earliest episode number where at least 70% of this episode’s audience finished fully watching all of the episodes in the season. Essentially, this metric tells you how quickly a certain season gets viewers addicted to a show.”
With that out of the way, here are the remaining insights for Sweet Magnolias seasons 1-3:
| Title (Season) | Date Indicator | Binge Watching (2+) | Get Hooked | Total Hours Watched | Unique Viewers |
|---|---|---|---|---|---|
| Season 1 | 7D | 74 | 7/10 | 26.0M | 7.0M |
| Season 2 | 7D | 81 | 6/10 | 33.1M | 6.6M |
| Season 3 | 7D | 77.2 | 6/10 | 22.1M | 4.7M |
| Season 1 | 28D | 78.4 | 4/10 | 58.5M | 13.6M |
| Season 2 | 28D | 86.5 | 2/10 | 62.1M | 10.5M |
| Season 3 | 28D | 84.1 | 3/10 | 45.2M | 7.5M |
| Season 1 | 90D | 80.2 | 3/10 | 76.5M | 17.0M |
| Season 2 | 90D | 88.3 | 1/10 | 73.9M | 11.9M |
| Season 3 | 90D | 85.9 | 2/10 | 56.4M | 8.8M |
Nicolás Herrera, a Data Analyst at PlumResearch, told us:
“The Unique Viewers for each season have been decreasing, with the latest installment having about 50% of the first season’s total viewers. However, the first season had the lowest engaging metrics. This is primarily reflected in the Completion Rate metric, where only about 55% of the audience fully watched all of the episodes of the season.
With all the seasons having the same format, a higher Binge Watching metric in season 2 reflects the ability of keeping the viewers interested, compelling them to watch at least 2 or more (BW 2+) episodes. Additionally, the Get Hooked metric for this season shows that at least 70% of the first episode audience finished all ten episodes of the season within 90 days, reflecting a robust engagement since the first episode”
We thank PlumResearch for providing this data to us and hope that it offers some insight into the show’s performance. We look forward to sharing more insights like this in the future.